
The short answer
There is no single official rule that says every restaurant website must finish loading in a fixed number of seconds. A more useful answer is to aim for Google's current “good” Core Web Vitals thresholds: Largest Contentful Paint at or below 2.5 seconds, Interaction to Next Paint at or below 200 milliseconds, and Cumulative Layout Shift at or below 0.1.
These results are assessed at the 75th percentile. In plain language, the goal is for at least 75 percent of page visits to meet the good threshold for each metric. That matters because a fast test in the office does not represent every guest using an older phone, mobile data, or a busy network.
For an owner, the practical question is not “How do I get 100?” It is “What is making the menu, booking path, room information, or directions feel slow or unstable for guests?”
The three numbers that matter
Core Web Vitals cover loading, responsiveness, and visual stability. Each one points to a different kind of hospitality website problem.
- Largest Contentful Paint (LCP), good at 2.5 seconds or less: This is when the main visible content has likely appeared. On a venue homepage, the LCP element is often a large hero photograph or heading. An oversized dining room image, food photograph, or room photograph can delay the moment a guest understands what the page offers.
- Interaction to Next Paint (INP), good at 200 milliseconds or less: This measures how responsive the page feels when a real person interacts with it. A slow menu filter, booking button, room date picker, gallery control, or reservation widget can make the page feel stuck even after it looks loaded.
- Cumulative Layout Shift (CLS), good at 0.1 or less: This measures unexpected movement of visible content. A gallery that changes height, a late loading font, or a booking widget that suddenly expands can push a button away just as a guest tries to tap it.
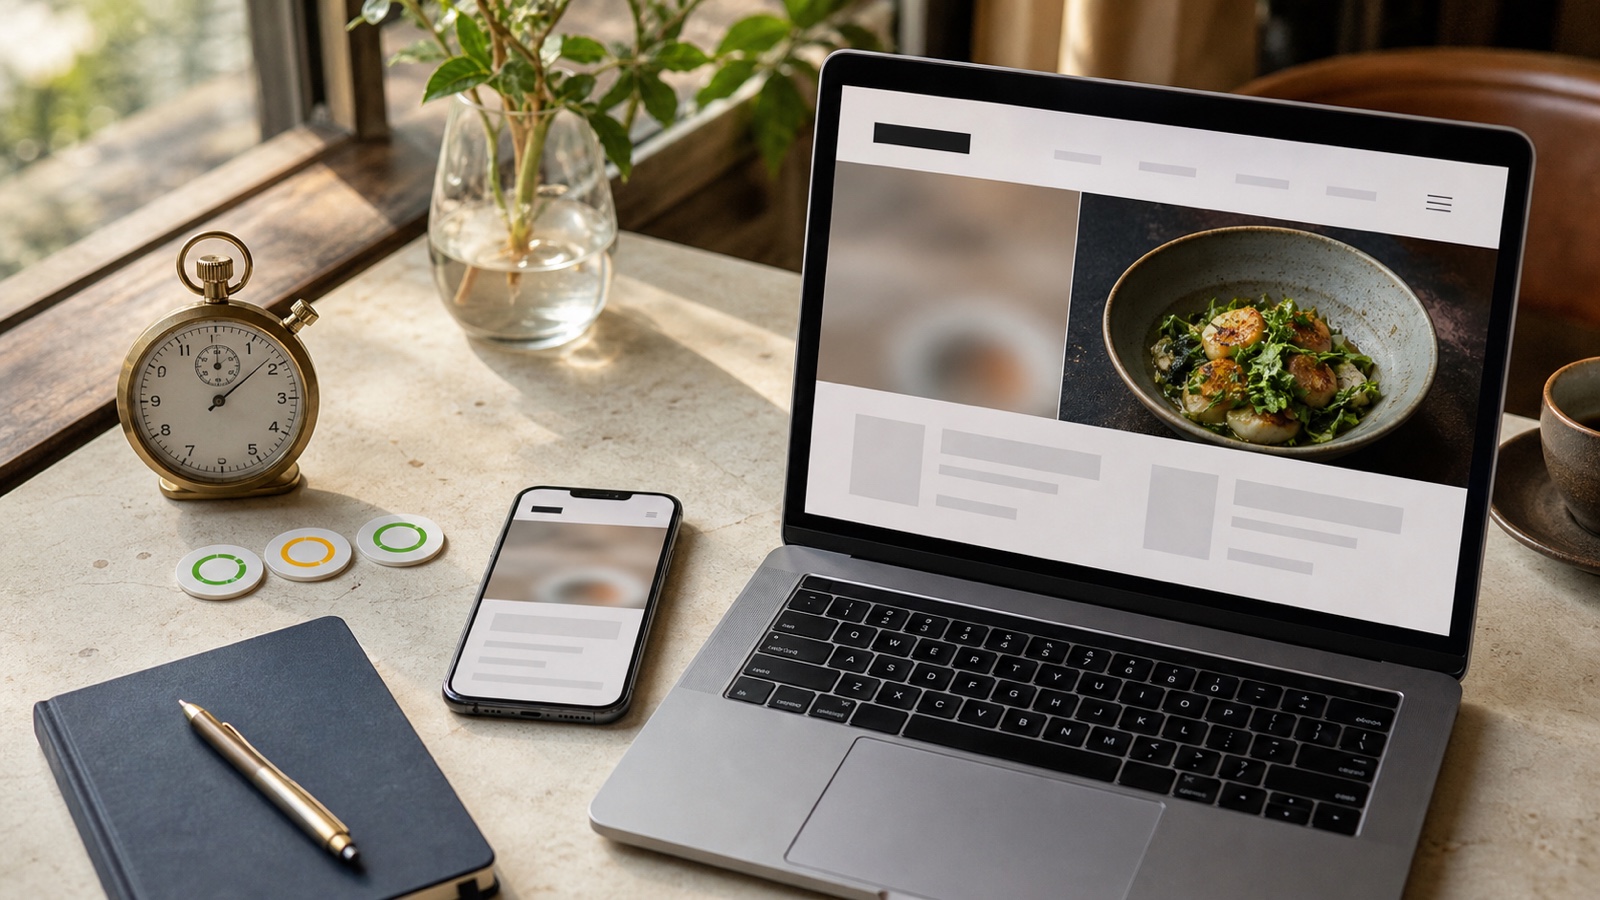
A page passes the Core Web Vitals assessment only when all three metrics meet their recommended targets at the 75th percentile. Look at mobile and desktop results separately. A venue site can feel comfortable on a laptop and still struggle on the phone a guest uses outside the restaurant.
Field data and lab tests answer different questions
Field data comes from real visits. It reflects the mix of devices, networks, and interactions people actually bring to the site. The Chrome User Experience Report provides anonymised real user data that appears in tools including PageSpeed Insights.
Lab data comes from a controlled or simulated test. It is useful for finding a likely cause, checking a page before launch, and comparing a change under repeatable conditions. It is not a substitute for the complete picture from real visits.
This distinction is especially important for INP. Lighthouse cannot directly measure INP when it loads a page in a simulated environment without a person interacting with it. It reports Total Blocking Time (TBT) as a lab proxy instead. Improving a poor TBT result may improve INP in the field, but the two numbers are not interchangeable.
Low traffic pages may not have enough real user data for a page-level field result. If PageSpeed Insights shows no URL-level field data, that absence does not prove the page is fast or slow. It may show broader origin data when available, while the lab section remains one simulated run. Use that run to find clues, then test the real menu, gallery, and booking path on phones.
What the scores mean for Google Search
Google says Core Web Vitals are used by its ranking systems and recommends good results for Search success and a better experience generally. It also makes the limit clear: good scores do not guarantee that a page will rank at the top. Relevance, useful content, and the wider page experience still matter.
That means chasing a perfect score solely for SEO may not be the best use of your time. Do not remove a useful menu, gallery, or booking function just to make a report look cleaner. Fix the implementation when it delays or disrupts the guest, and keep the content and actions the guest came to use.
Speed also sits beside clarity. A fast PDF that is painful to read is not a good menu journey. Compare the options in restaurant menu PDF or web page. If the reservation step is the problem, check where the action belongs with our guide to restaurant booking links on your website or Google.
What a venue owner should fix first
- Protect the main guest task. Confirm that the current menu, booking action, room availability, phone number, and directions work. A broken or unclear task comes before a small score improvement.
- Fix the failing Core Web Vital. If field data shows a poor LCP, INP, or CLS result, start there. Do not spread the budget across every suggestion in the report.
- Start with the largest visible content. For poor LCP, check the homepage hero and the main image on menu, booking, and room pages. Ask whether the browser is downloading a photograph much larger than the phone needs, and whether the correct image begins loading promptly.
- Test the interactions guests actually use. For poor INP or a worrying TBT lab result, open the menu, choose a date, move through the gallery, and start a booking. Look for heavy scripts or widgets that make those actions wait.
- Reserve space before content arrives. For poor CLS, watch the gallery, web fonts, banners, and booking widget. Images and embedded tools should have a stable area so they do not push the next action down the page.
- Retest the page and the journey. Check the result again, then complete the task on a real phone. A technical improvement is useful only if the menu, booking, or enquiry still feels clear.
For the rest of the phone experience, use the restaurant website mobile UX checklist. It covers tap targets, forms, readable content, and the real guest path that a speed report cannot judge.
Start with PageSpeed Insights
PageSpeed Insights is a useful free starting point. Test the homepage and one important page, such as the menu, booking, or rooms page. Read the field and lab sections separately, note which metric needs attention, and save the specific recommendation you want a developer to investigate.
It is a diagnostic starting point, not a sales tool and not proof that a website will create bookings. Run it again after a meaningful change, but also repeat the real guest task.
Open PageSpeed InsightsA compact decision checklist
- Does field data show that LCP, INP, or CLS misses the good threshold?
- If there is no page-level field data, have you treated the lab result as a clue rather than a verdict?
- Can a guest still find and use the menu, booking, room, phone, and directions?
- For LCP, is the main hero or content image correctly sized and loaded promptly?
- For INP or TBT, have you tested the actual menu, booking widget, date picker, and gallery controls?
- For CLS, have you watched for shifts caused by galleries, fonts, banners, and booking widgets?
- After the change, did you rerun the test and complete the main journey on a real phone?
If you can name the failed metric, the affected page, and the guest action it disrupts, you have a useful brief. The broader checks in how we score restaurant websites can help you decide whether speed is truly the first priority or one part of a wider clarity problem.
Want help choosing the first fix?
If the report gives you a long list but no clear decision, the US$35 Website Check turns the live site into a short priority list across mobile clarity, menu or stay information, booking, and search visibility.
Get the US$35 Website CheckSources
- web.dev, Web Vitals
- web.dev, defining the Core Web Vitals metric thresholds
- Google Search Central, understanding page experience in Google Search results
- Google PageSpeed Insights